


RoboCenter
Browser-Based Real-Time Monitoring for Your Entire Welding Production

All Welding Systems. One Dashboard.
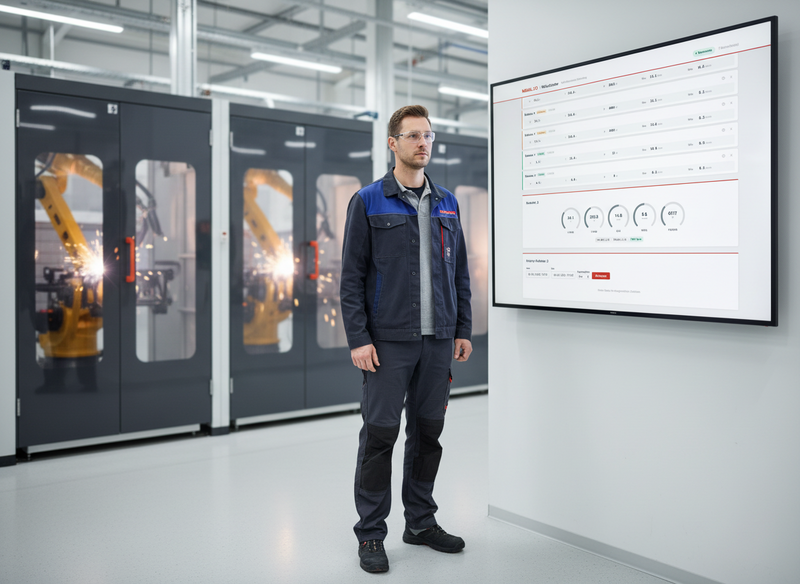
RoboCenter is the central monitoring platform for MIGAL.CO Sensorboxes and network-capable welding systems (MQTT) from other manufacturers. Monitor voltage, current, power, shielding gas flow, and wire feed of all your welding systems in real time – from any workstation, from the office, or on the go.
Whether a single welding cell or an entire production area with dozens of systems: RoboCenter automatically detects new Sensorboxes and immediately displays the current operating status in the browser. No installation, no additional software required.
You can test the functions of RoboCenter LIVE in our simulator. NOTE: The data in the database is deleted after 24 hours and changes are reset after 15 minutes.
Features
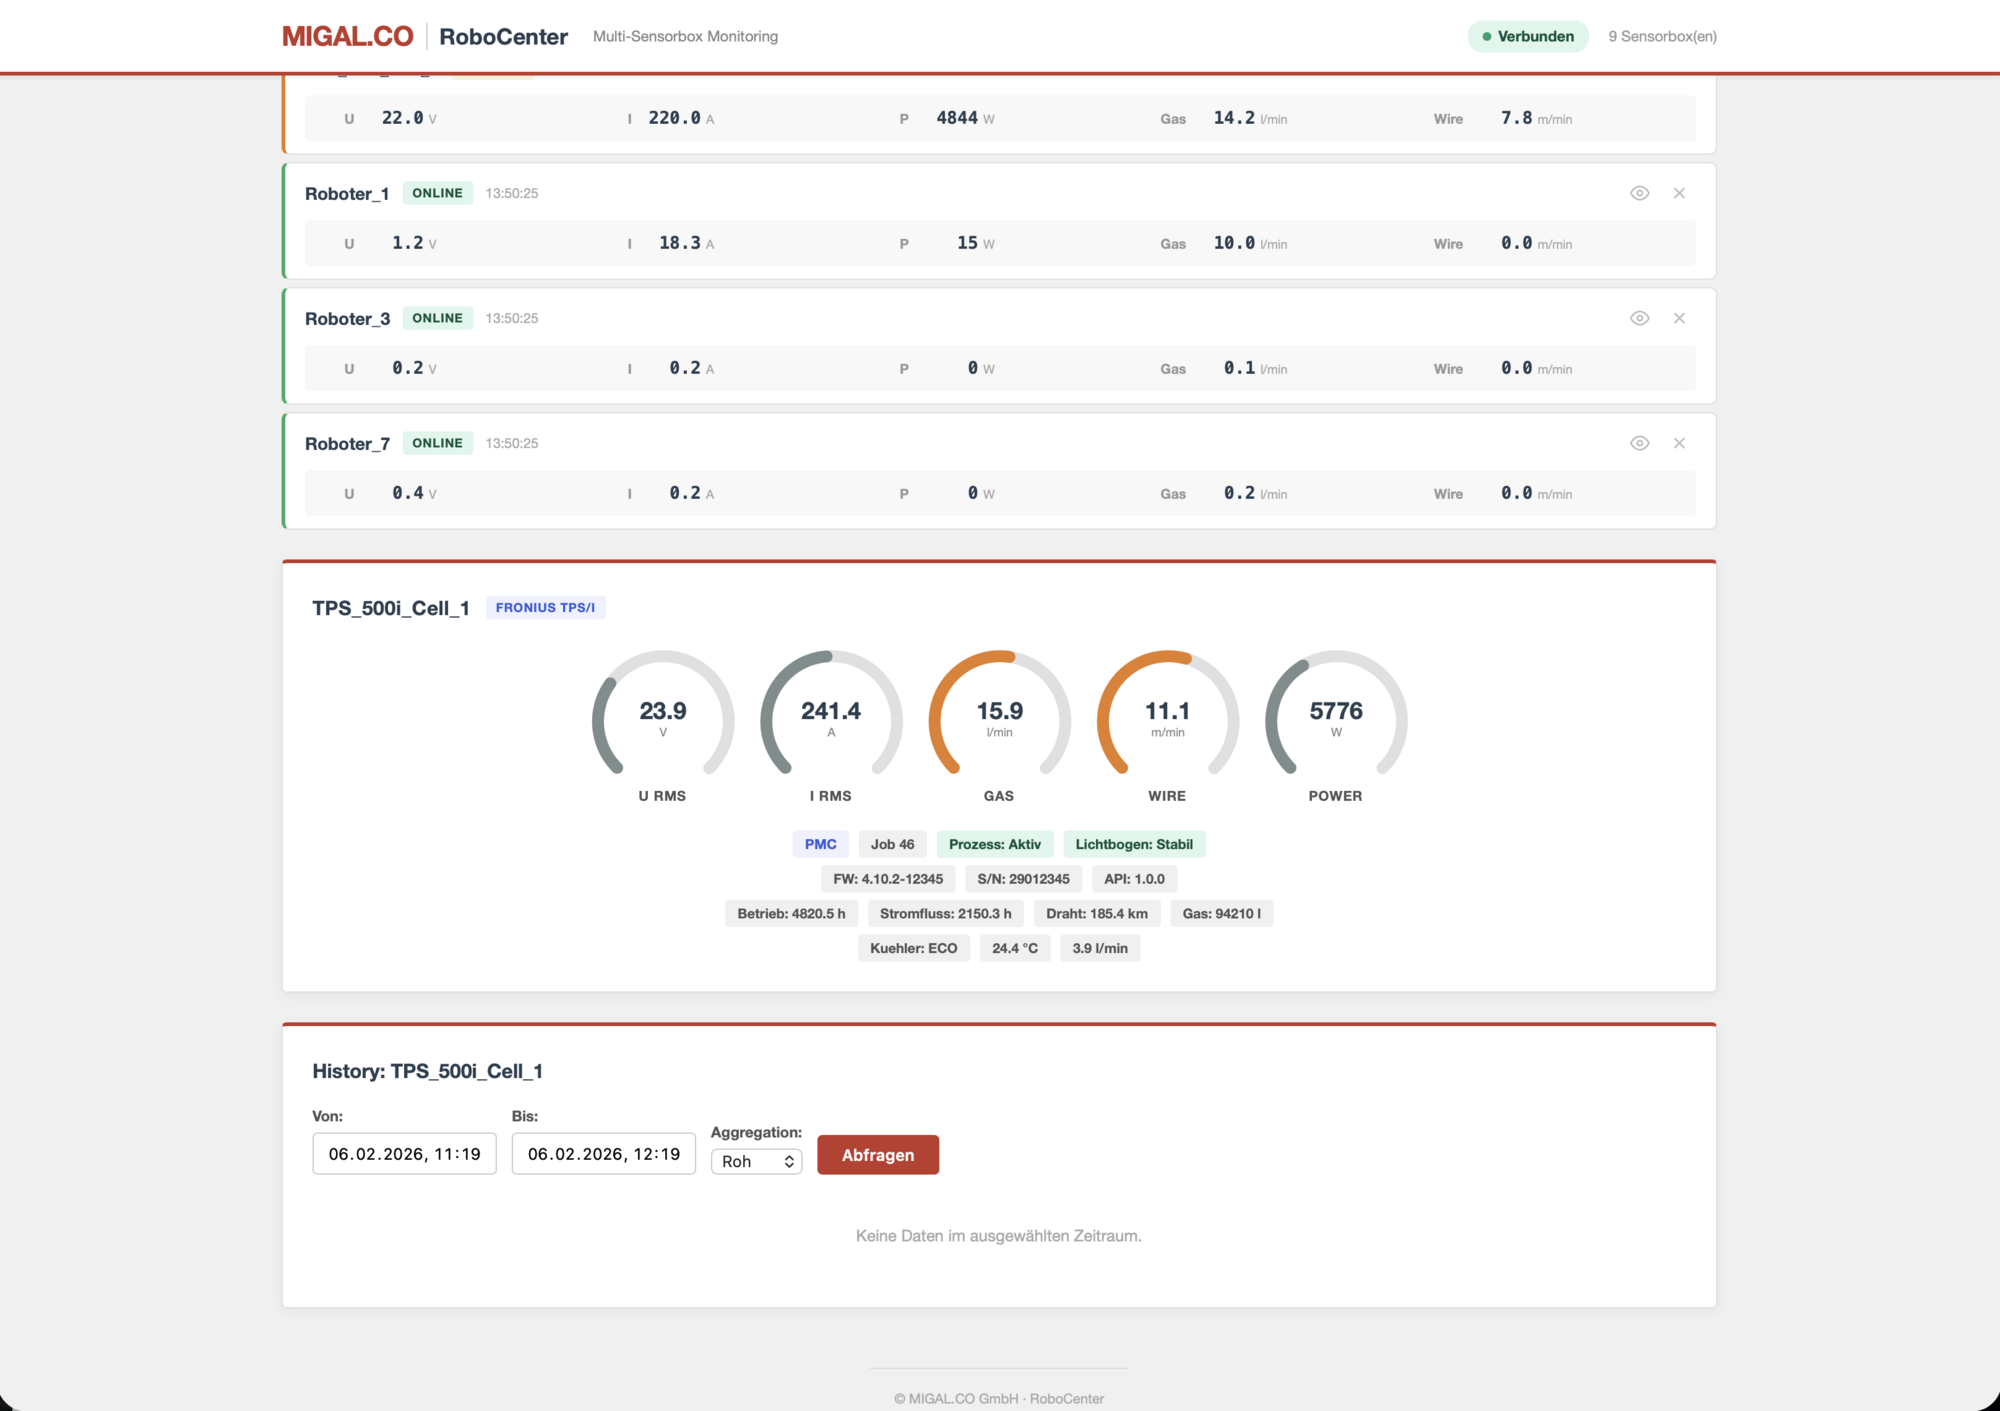
Real-Time Dashboard
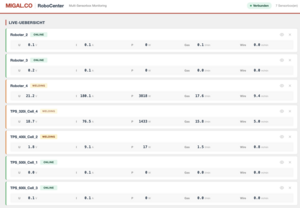
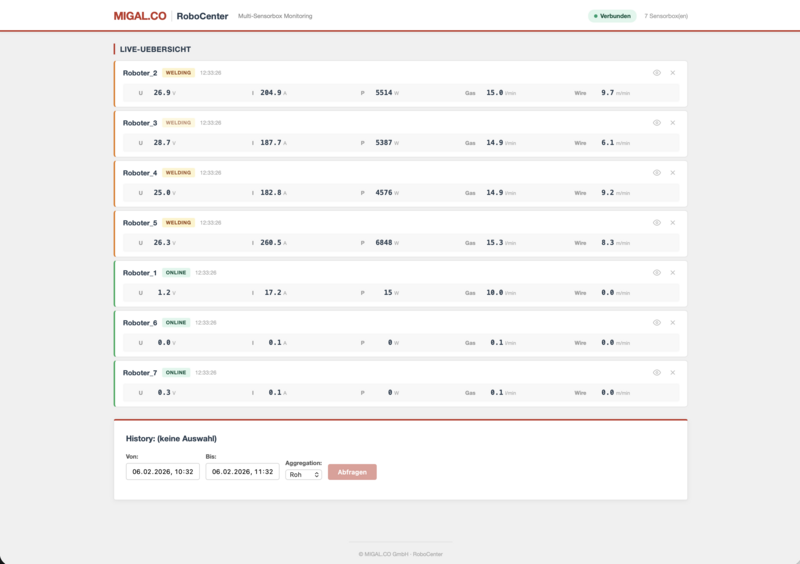
All connected Sensorboxes are displayed live in a clear table. Active welding positions are automatically listed at the top, followed by idle systems and offline devices. The measured values are updated in real time via WebSocket technology – without manual page reloading.
Welding Parameters at a Glance
For each Sensorbox, the five most important process parameters are displayed in tabular form:
- Voltage (U) in Volts
- Current (I) in Amperes
- Power (P) in Watts
- Shielding gas flow in l/min
- Wire feed speed in m/min
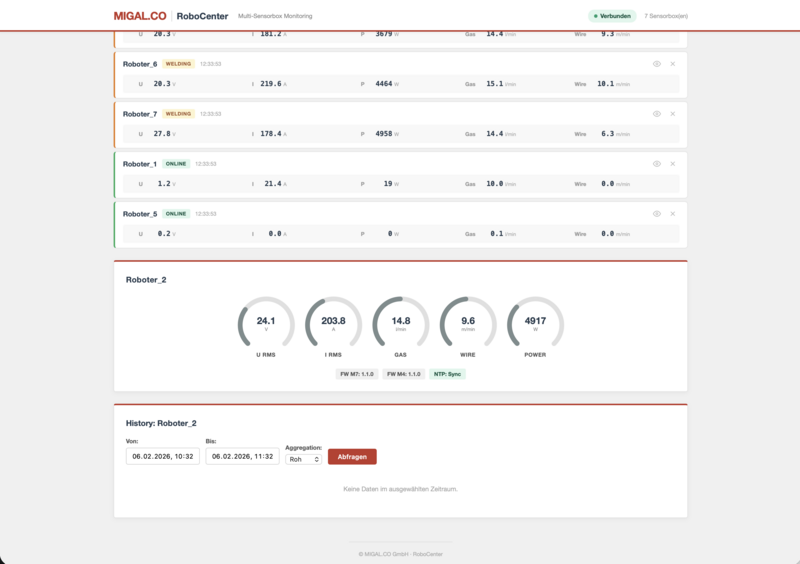
Clicking on a Sensorbox opens a detail panel with five animated donut gauges for visual assessment of the current utilization.
Automatic Status Detection
RoboCenter automatically detects the operating status of each system:
- ONLINE – Sensorbox connected, system idle
- WELDING – Welding process active (wire feed detected)
- OFFLINE – No data received since configurable timeout
The welding status is color-highlighted and prioritized in the sorting so that active welding positions always remain in view.
Historical Data Analysis
All incoming measured values are automatically stored in a time-series database (InfluxDB). Past time periods can be specifically queried via the integrated history section:
- Freely selectable time range (from/to)
- Aggregation levels: raw data, 1s, 5s, 30s, 1 min, 5 min
- Display as line chart with voltage, current, gas, and wire feed
- Export-capable REST API for further processing in external systems
Device Management
Sensorboxes that are no longer in use can be hidden or completely removed from the display. A toggle allows hidden devices to be made visible again when needed.

Technical Key Data
| Property | Value |
|---|---|
| Display | Web browser (desktop, tablet, mobile device) |
| Number of Sensorboxes | Unlimited |
| Update rate | Real-time (< 100 ms latency via WebSocket) |
| Communication | MQTT (Sensorbox → Broker → Backend) |
| Data storage | InfluxDB time-series database |
| API | REST + WebSocket, OpenAPI documentation |
| Deployment | Docker Compose (4 containers) |
| Operating system | Platform-independent (Linux, Windows, macOS) |
| Installation | No client installation required |
```
System Architecture
Each Sensorbox sends its measured values via MQTT to a central message broker. The backend receives the data, stores it in InfluxDB, and distributes it in real time via WebSocket to all connected browsers. The entire stack runs containerized and can be started with a single command.
Requirements
- MIGAL.CO Sensorbox with MQTT firmware
- Server or PC with Docker (Linux, Windows, or macOS)
- Network connection between Sensorboxes and server
- Web browser (Chrome, Firefox, Edge, Safari)
Use Cases
Production Monitoring – The production manager monitors all welding systems in the facility on a central screen. Active welding positions are immediately recognizable, offline notifications stand out.
Quality Assurance – Via the history function, welding processes are retrospectively analyzed. Deviations in voltage, current, or gas flow can be narrowed down in time and documented.
Remote Monitoring – Service technicians check the system status and firmware versions of the Sensorboxes remotely – without having to be on-site.
Multi-Site Operation – Sensorboxes from different locations send their data to a central RoboCenter server. The overview shows all systems across all sites.
Data from Welding Systems of Other Manufacturers
Fronius TPS/i Integration
RoboCenter natively supports Fronius TPS/i welding machines via the MQTT interface. In addition to the five standard welding parameters, Fronius-specific information is displayed:
- Welding process: Active mode (PMC, LSC, CMT, Standard, etc.)
- Arc stability: Real-time display of arc status
- Job management: Active job number and job mode
- Error codes: Immediate display of active faults
- System counters: Total operating hours, current flow time, consumed wire length, and shielding gas volume
- Cooler monitoring: Mode, temperature, and flow rate
- Device data: Serial number, firmware version, API version
Fronius devices are automatically labeled as "Fronius TPS/i" in the dashboard and show a customized detail panel with all available machine data.
RoboCenter – Frequently Asked Questions (FAQ)
General
What is RoboCenter?
RoboCenter is a browser-based real-time monitoring platform for welding systems. It displays voltage, current, power, shielding gas flow, and wire feed of all connected systems live in a dashboard.
Which welding systems are supported?
RoboCenter currently supports two device types:
- MIGAL.CO Sensorboxes – universal measurement boxes that can be connected to any welding system
- Fronius TPS/i – direct connection via the built-in MQTT interface of Fronius welding machines
Additional manufacturers can be added via the modular bridge system.
How many systems can RoboCenter monitor simultaneously?
There is no artificial upper limit. In practice, dozens to hundreds of systems are possible simultaneously. The number is limited only by the server hardware and network bandwidth.
Is special software required on the PC?
No. RoboCenter runs entirely in the web browser – Chrome, Firefox, Edge, or Safari are sufficient. Nothing needs to be installed on the workstations.
Installation and Operation
What is required for the server?
Any PC or server with Docker. The operating system does not matter (Linux, Windows, or macOS). A current office PC or a mini PC (e.g. Intel NUC) is sufficient for most installations.
How long does the setup take?
After installing Docker, RoboCenter is operational with three commands:
git clone ... && cd RoboCenter && docker compose up -d --build
The first start takes approximately 1–3 minutes (one-time image build). After that, the dashboard is accessible at <Server-IP>:3000.
Does RoboCenter restart automatically after a server reboot?
Yes. All containers are configured with automatic restart. As soon as the Docker service runs at system startup, all RoboCenter services start automatically – without manual intervention.
Does RoboCenter require regular maintenance?
No. The system runs maintenance-free. Updates can be applied when needed with git pull && docker compose up -d --build. Stored measurement data is preserved during updates.
Can RoboCenter run on a Raspberry Pi?
In principle, yes, provided Docker is installed. However, for larger installations with many systems and long data history, we recommend a more powerful computer.
Welding Systems and Connectivity
How are the Sensorboxes connected to RoboCenter?
The Sensorboxes send their measurement data via MQTT (standard IoT protocol) over the company network to the RoboCenter server. A network connection (LAN or WLAN) between the Sensorbox and server is required.
Does RoboCenter detect new systems automatically?
Yes. As soon as a new Sensorbox or Fronius TPS/i sends data, it automatically appears in the dashboard – without manual configuration.
What happens when a system goes offline?
RoboCenter automatically detects the failure after a configurable timeout (default: 10 seconds) and displays the system as "Offline". As soon as the system sends data again, the status switches back.
Can MIGAL.CO Sensorboxes and Fronius TPS/i be monitored simultaneously?
Yes. Both device types run in parallel in the same dashboard. RoboCenter automatically detects the device type and displays the appropriate detail information for each.
What Fronius data is displayed?
In addition to the standard welding parameters (voltage, current, power, gas, wire), RoboCenter additionally displays for Fronius TPS/i:
- Welding process (PMC, LSC, CMT, Standard, ...)
- Arc stability and process status
- Active job number and job mode
- Error codes
- Total counters (operating hours, current flow time, wire consumption, gas consumption)
- Cooler temperature and flow rate
- Serial number and firmware version
Can I remove systems from the dashboard?
Yes. Systems that are no longer in use can be hidden or completely removed. Hidden systems can be made visible again at any time. Removed systems automatically reappear as soon as they send data again.
Data and Analysis
Is the measurement data stored?
Yes. All incoming measured values are automatically stored in a time-series database (InfluxDB). The data is available for later evaluations.
How long is the data retained?
By default, indefinitely. The storage duration depends only on the available disk space. If needed, an automatic cleanup rule (retention policy) can be set up in InfluxDB.
Can I analyze past welding processes?
Yes. Via the integrated history section, any time period can be selected. The display shows voltage, current, gas, and wire feed as a line chart. Various aggregation levels (raw data to 5-minute averages) enable both detailed analysis of individual welds and an overview of longer time periods.
How much data volume is generated per day?
Per device and day, approximately 20 MB of MQTT network traffic and approximately 10 MB of database storage are generated (at a 1-second transmission interval).
| Number of devices | Network/day | Database/day | Network bandwidth |
|---|---|---|---|
| 5 devices | ~100 MB | ~50 MB | ~10 kbit/s |
| 10 devices | ~200 MB | ~100 MB | ~20 kbit/s |
| 20 devices | ~400 MB | ~200 MB | ~40 kbit/s |
| 50 devices | ~1 GB | ~500 MB | ~100 kbit/s |
Per data point, 7 measured values are stored: voltage (U), current (I), power (P), wire feed, gas flow, gas correction factor, and sequence number. InfluxDB additionally compresses the data by approximately 50–70%, so the actual disk consumption is significantly lower.
Rule of thumb: 20 MB per device per day (network), 10 MB per device per day (database). The required network bandwidth is negligibly small even with 50 systems.
Can the data be exported?
Yes. RoboCenter provides a REST API through which measurement data can be retrieved in JSON format. This allows the data to be imported into external systems (e.g. Excel, ERP, QA software).
Network and Security
Does RoboCenter require an internet connection?
No. RoboCenter runs entirely on the local network. An internet connection is only needed for the initial installation (downloading Docker images) and for updates.
Is RoboCenter accessible via the internet?
By default, RoboCenter is only accessible on the local network. For remote access, a VPN or reverse proxy can be set up. We recommend not exposing the dashboard unprotected to the internet.
Which ports must be opened in the firewall?
For normal operation, two ports are required:
- Port 3000 – Web dashboard (browser access)
- Port 1883 – MQTT (communication with the welding systems)
Can multiple people access the dashboard simultaneously?
Yes. Any number of browsers can open the dashboard simultaneously. Everyone sees the same real-time data.
Is the MQTT communication encrypted?
RoboCenter supports encrypted MQTT connections via TLS/SSL (port 8883). Both MIGAL.CO Sensorboxes and Fronius TPS/i machines can establish TLS-secured connections to the MQTT broker. This means the welding data is encrypted along the entire transport path between the system and the server.
Additionally, the MQTT broker can be secured with username/password authentication, so that only authorized devices can send and receive data.
In an isolated production network, encryption is generally not strictly necessary. However, as soon as data travels over public or shared networks (e.g. multi-site operation via VPN), we recommend enabling TLS.
Extensibility
Can RoboCenter be extended to support additional manufacturers?
Yes. The backend is modularly structured. For each new device type, a dedicated bridge is written that receives the manufacturer-specific MQTT data and converts it into the unified RoboCenter data format. The frontend automatically adapts the detail view to the available data fields.
Can I set up alarms or notifications?
This feature is planned for a future version. Currently, the dashboard shows the live status but does not yet send automatic notifications in case of faults.
Is there an API for custom applications?
Yes. RoboCenter provides a fully documented REST API as well as a WebSocket interface for real-time data. The interactive API documentation is accessible at <Server-IP>:8000/docs.
Does RoboCenter support OPC UA?
An OPC UA connection is possible on request and is already being planned.
Advantages of OPC UA over MQTT:
- No broker required – the machine is addressed directly (peer-to-peer), eliminating the need for a separate MQTT broker
- Write access – set job numbers, send trace data (article number, serial number, seam number) to the machine, remotely control welding parameters
- More data – additional information such as traceability, safety status, wire-end detection, and ongoing welding time
- Integrated security – encryption and authentication are built into the protocol (certificates, username/password). MQTT also supports this via TLS (see next question).
- Industry standard – OPC UA is the most widely used protocol for industrial automation and MES/ERP integration
Disadvantages compared to MQTT:
- Individual configuration – each machine must be registered as an endpoint (IP address), whereas with MQTT new devices are automatically detected
- Higher complexity – certificate management and security settings must be configured on each machine
Recommendation: For pure monitoring of many systems, MQTT is the simpler solution. As soon as write access (jobs, traceability) or a broker-less direct connection is needed, OPC UA is the better choice. Both protocols can also be operated in parallel.
If you are interested in OPC UA integration, please contact us.